Predikce meziodistálních šířek neprořezaných stálých špičáků a premolárů pomocí Moyersových tabulek
pro českou populaci
Prediction of mesiodistal width of unerupted permanent canines and premolars with Moyers probability tables in the Czech population




MDDr. Barbora Nedvědová, MUDr. Hana Tycová, doc. MUDr. Josef Kučera, Ph.D., MUDr. Jiří Tvardek, Ph.D.
Ortodontické oddělení, Stomatologická klinika 1. LF UK a VFN, Praha / Department of Orthodontics, Clinic of Stomatology, 1st Medical Faculty of Charles University and University Hospital, Prague
DOI10.61110/50539
Souhrn
Cíl: Cílem studie bylo ověřit relevantnost použití Moyersových tabulek pro českou populaci a navrhnout alternativní predikční tabulky, které by lépe reflektovaly specifika české populace. Dále jsme se zaměřili na průměrné meziodistální šířky zubů a analýzu pohlavního dimorfismu v šířce zubů.
Materiál a Metodika: Do retrospektivní studie bylo zahrnuto 345 pacientů české národnosti (141 mužů a 204 žen). Měření meziodistálních šířek zubů bylo provedeno virtuálně na intraorálních skenech pomocí softwaru 3Shape OrthoAnalyzer®. Výsledky byly následně podrobeny statistické analýze.
Výsledky: Nejvíce variabilní v meziodistální šířce je horní pravý postranní řezák (variační koeficient = 5 %), nejméně první horní moláry (variační koeficient = 5 %). Muži mají všechny zuby statisticky signifikantně širší než ženy, přičemž nejvýraznější rozdíl byl u dolních špičáků. Moyersovy tabulky podhodnocují skutečné rozměry špičáků a premolárů v naší populaci. Korelační analýza identifikovala součet šířek všech prvních molárů jako nejsilnější prediktor pro šířku neprořezaných špičáků a premolárů (R² = 0,534 pro dolní a 0,511 pro horní čelist). Na základě tohoto modelu byly vytvořeny predikční tabulky pro českou populaci, které poskytují přesnější odhad potřebného místa pro neprořezané špičáky a premoláry.
Závěr: Použití predikčních metod pomocí Moyersovy tabulky nejsou pro českou populaci optimální, neboť podhodnocují prostorové nároky pro neprořezané špičáky a premoláry.
(Ortodoncie 2025, 34, č. 4, s. 220–236)
Abstract
Aim: The aim was to prove verify relevancy of Moyers tables for the Czech population and propose alternative prediction tables to better respond the specifics of the Czech population. We also focused on the average mesiodistal widths of teeth and on the analysis of sexual dimorphism in the teeth width.
Material and method: The retrospective study included 345 Czech nationals (141 male and 204 female). Measurement of mesiodistal widths was performed virtually in intraoral scans with software 3Shape OrthoAnalyzer®. The results were statistically processed.
Results: The greatest variability of mesiodistal width is found in maxillary right lateral incisor (variable coefficient = 5%), the least in maxillary first molars (variable coefficient = 5%). In males all teeth are significantly wider than in females; the most statistically significant difference was found in lower canines. Moyers tables underestimate actual dimensions of canines and premolars in our population. Correlation analysis identified the sum of widths of all first molars as the strongest predictor of the width of unerupted canines and premolars (R2 = 0.534 for the mandible and 0.511 for the maxilla). Based on this model we produced prediction tables for the Czech population which provide more accurate estimate of the space required for unerupted canines and premolars.
Conclusion: Moyers probability tables are not optimal for the Czech population as they underestimate space required for unerupted canines and premolars.
(Ortodoncie 2025, 34, No. 4, p. 220–236)

Klíčová slova: meziodistální šířky špičáků a premolárů, predikce šířek zubů, Moyersovy tabulky
Key words: mesiodistal width if of canines a premolars, prediction of size of teeth, tooth size prediction, Moyers probability tables
Úvod
V období smíšeného chrupu můžeme pozorovat různé ortodontické problémy, které často pramení z nesouladu mezi délkou oblouku a velikostí zubů. Klinicky se nesoulad projevuje stěsnáním nebo mezerami. K prevenci nebo časné intervenci je u těchto problémů nutné mít určitou představu o budoucích rozměrech stálých zubů, které prořezávají ve druhé fázi výměny chrupu. Přesná predikce potřebné vzdálenosti pro prořezávající špičáky a premoláry je zásadní pro plánování ortodontické léčby. Analýza prostoru ve smíšeném chrupu umožňuje odhadnout, jaký bude v zubním oblouku k dispozici prostor pro stálé zuby, a tím poskytuje základ pro stanovení léčebného plánu a určení potřebných intervencí, jako jsou sériové extrakce, řízené prořezávání, držení prostoru, získání ztraceného prostoru, anebo pozorování vývoje chrupu pacienta bez intervence [1].
Vývoj metod pro predikci meziodistálních rozměrů neprořezaných zubů sahá až do počátku 20. století, kdy byly Blackem publikovány tabulky průměrných rozměrů zubů [2]. Tyto průměrné hodnoty se však ukázaly být nespolehlivé z důvodu velké variace ve velikosti zubů mezi jedinci. Následovaly metody založené na rentgenologických vyšetřeních [3–7], statistických analýzách a jejich kombinacích [8–10], které umožnily přesnější odhady. Celosvětově nejpoužívanější se stala Moyersova analýza, publikovaná v roce 1971 v knize Handbook of Orthodontics [8]. Dnes se v klinické praxi rozšiřuje použití pokročilých zobrazovacích technologií, jako je cone beam počítačová tomografie (CBCT), která poskytuje trojrozměrné zobrazení chrupu a možnost měření neprořezaných zubů. Přestože se CBCT stává běžnou součástí ortodontické diagnostiky a plánování, jeho použití by mělo být indikováno pouze v případech, kdy je to z medicínského hlediska opodstatněné a samotná potřeba měření neprořezaných zubů by neměla být důvodem k zhotovení CBCT snímku.
I přesto je Moyersova metoda standardním nástrojem v současné ortodontické praxi, a to díky její jednoduchosti, rychlosti a neinvazivitě [11]. Skutečnost, že byla tato metoda vyvinuta na základě dat americké populace severoevropského původu, vyvolává otázky ohledně její přesnosti při aplikaci na jiné populace, neboť odborná literatura poskytuje řadu důkazů o rozdílných meziodistálních rozměrech korunek zubů mezi jedinci a populacemi [12–18].
Pro českou populaci dosud nebyla podobná studie ověřující přesnost těchto predikčních metod provedena. Cílem této studie tedy bylo ověřit přesnost stávající metody a zpracovat nové predikční modely, které by lépe reflektovaly specifické charakteristiky české populace a přispěly k přesnější diagnostice a efektivnější léčbě ortodontických pacientů.
Materiál
Tato retrospektivní studie byla provedena se souhlasem Etické komise Všeobecné fakultní nemocnice v Praze (č.j.: 81/24 S-IV). Pacienti i zákonní zástupci byli poučeni o účasti ve vědeckém projektu a byl získán jejich informovaný souhlas. Intraorální skeny pacientů byly shromážděny z Ortodontického oddělení 1. LF UK a VFN v Praze, privátní praxe MUDr. Jiřího Tvardka, Ph.D. (Hustopeče), MUDr. Tomáše Hanzelky, Ph.D. (Praha) a MUDr. Zuzany Hýskové (Držkov). Sběr dat probíhal od ledna 2022 do června 2024. Do studie byly zařazeni pacienti, kteří splnili následující kritéria:
1. Pacienti české národnosti (minimálně dvě generace).
2. Pacienti bez předchozí ortodontické léčby.
3. Pacienti s prořezanými stálými zuby v minimálním rozsahu 16–26, 36–46, přičemž všechny zuby mají meziální a distální plochy přístupné pro měření.
4. Pacienti bez anomálií v počtu a tvaru zubů, a to v rozsahu 16–26, 36–46.
5. Pacienti bez kariézních lézí, výplní a fraktur, které zasahují aproximální plochy zubů a narušují tak meziodistální rozměr zubů.
6. Dobře čitelný panoramatický snímek ze vstupního ortodontického vyšetření či preventivního vyšetření u praktického zubního lékaře.
7. Intraorální sken horní a dolní čelisti ze vstupního ortodontického vyšetření či preventivního vyšetření u praktického zubního lékaře.
Vzhledem k tomu, že byly k dispozici pouze intraorální skeny, nikoli klinické vyšetření pacienta, byly případné nejasnosti v kritériích 3., 4. a 5. ověřeny na panoramatickém snímku, kterým disponovali všichni pacienti.
Finální soubor tvořilo 345 pacientů: 141 (40,9 %) mužů a 204 (59,1 %) žen. Průměrný věk byl 18,3 ± 6,5 roků, věkové rozmezí 11 až 56 let, medián věku byl 16 let. 284 (82,3 %) skenů a OPG snímků pocházelo z ortodontických praxí, zbylých 61 (17,7 %) bylo získáno od praktických zubních lékařů.
Metodika
Všechny intraorální skeny byly zhotoveny na přístroji 3Shape TRIOS (3Shape A/S, Kodaň, Dánsko). Shromážděné skeny pacientů byly konvertovány do formátu STL a vloženy do programu 3Shape OrthoAnalyzer® (3Shape Ortho System, 3Shape A/S, Kodaň, Dánsko), ve kterém byly nejprve zhotoveny virtuální modely a následně probíhalo měření meziodistálních šířek autorem této studie.
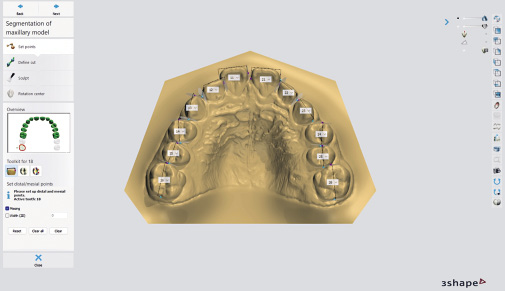
Měřeny byly meziodistální šířky všech zubů v rozsahu 16–26, 36–46. Před měřením každého zubu byl model libovolně přibližován a otáčen, aby bylo možné přesně identifikovat optimální umístění bodů. Šířka každého zubu byla následně při dostatečném přiblížení manuálně definována označením meziálního a distálního bodu v nejširším místě klinické korunky při pohledu z okluze. Výsledkem bylo získání hodnoty meziodistální šířky zubů v milimetrech s přesností na dvě desetinná místa.
Pro určení chyby měření byla u 20 náhodných pacientů s odstupem 4 týdnů stejným lékařem a na stejném přístroji zopakována měření meziodistálních šířek zubů. Relativní Dahlbergova chyba se pohybovala mezi 0,81 % (pro zub 21) až 2,7 % (pro zub 25). Hodnoty koeficientu ICC byly zjištěny v rozmezí 0,787 (zub 14) až 0,979 (zub 12), což představuje výbornou shodu. Párovým t-testem nebyla zjištěna systematická chyba (p-hodnoty byly větší než 0,05 u všech zubů).
Výsledky měření byly zaznamenány do tabulky v programu Excel (Microsoft Excel pro Mac, verze 16.81). Ke statistickému zpracování byl použit statistický software IBM SPSS Statistics for Windows (Version 23.0, Armonk, NY: IBM Corp). Grafy byly vytvořeny v programu TIBCO STATISTICA version 14.0. Statistické zpracování provedla Mgr. Kateřina Langová, Ph.D. z Katedry lékařské biofyziky LF UP v Olomouci.
Výsledky
Průměrné meziodistální šířky zubů v české populaci
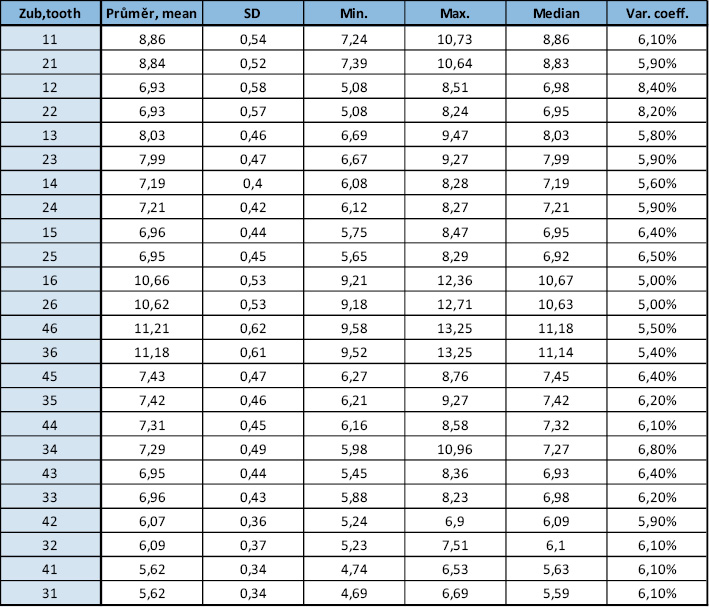
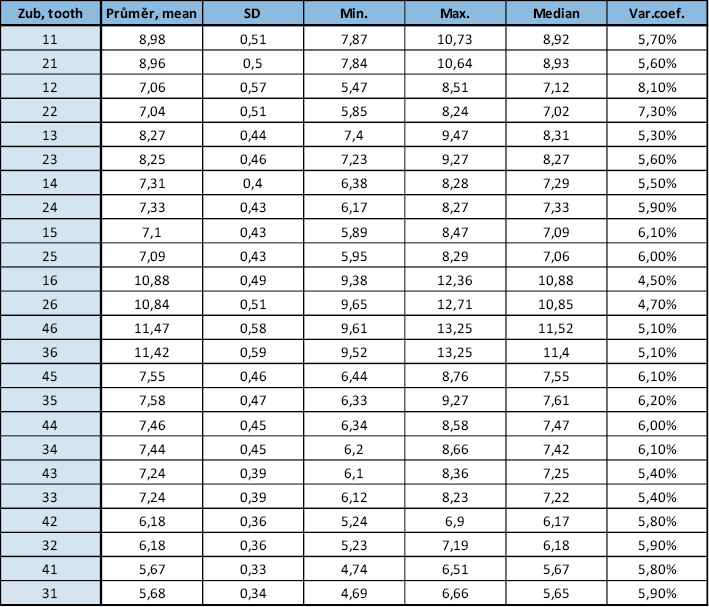
Průměrné meziodistální šířky zubů (v milimetrech) v české populaci v rozsahu 16–26, 36–46 jsou zpracovány formou tabulek (Tab. 1–3). Kromě průměrných hodnot jsme sledovali i variabilitu meziodistálních šířek jednotlivých zubů.
Nejnižší variabilita šířek zubů v české populaci je u zubů 16 a 26 (variační koeficient = 5 %), naopak nejvyšší variabilita je u zubů 12 a 22 (variační koeficient = 8,4 % a 8,2 %). Nejnižší variabilitu šířek zubů u mužů vykazují zuby 16 a 26 (variační koeficient = 4,5 % a 4,7 %), nejvyšší variabilitu zub 12 (variační koeficient = 8,1 %) U zubu 22 byla zjištěn variační koeficient 7,3 %, což je výrazně méně ve srovnání se zubem 12. Nejnižší variabilita šířek zubů u žen je u zubu 26 a 16 (variační koeficient = 4,7 % a 4,8 %), nejvyšší variabilita šířek zubů byla shledána u zubů 22 a 12 (variační koeficient = 8,6 % a 8,4 %). Průměrná hodnota variačního koeficientu u mužů je 5,8 %, u žen 5,9 %. U žen je variabilita zubů mírně vyšší, rozdíl ale není statisticky významný, p = 0,645.
Rozdíly v meziodistální šířce zubů mezi pohlavími
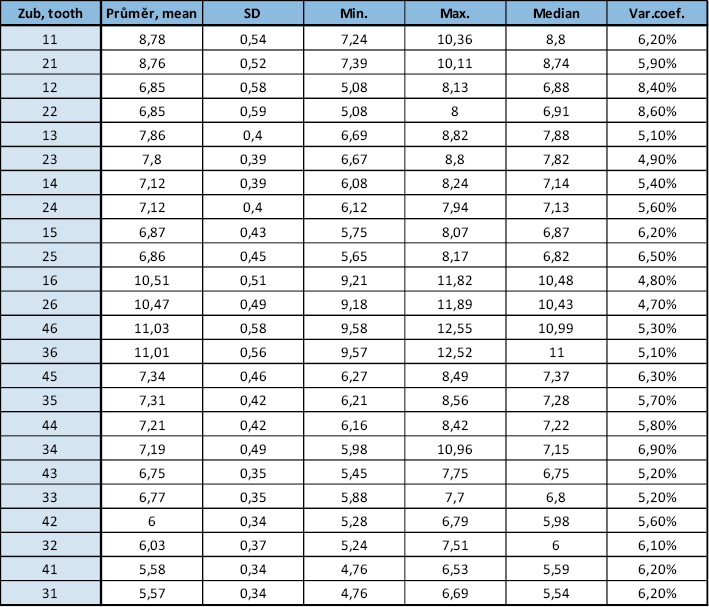
Dvouvýběrovým t-testem bylo prokázáno, že muži mají statisticky významně širší zuby než ženy, p < 0,05 u všech zubů (Tab. 4). Největší pohlavní dimorfismus vykazují dolní špičáky s průměrnou diferencí 0,47 (zub 33) a 0,50 (zub 43), následované horními špičáky. Výrazně pohlavně dimorfní jsou také dolní první moláry a horní první moláry. Nejméně dimorfní jsou dolní střední řezáky s průměrnou diferencí 0,09 (zub 41) a 0,10 (zub 31).
Predikce šířek neprořezaných špičáků a premolárů na základě součtu šířek dolních řezáků – modifikace Moyersovy tabulky pro českou populaci
Na základě získaných údajů o meziodistálních šířkách zubů v české populaci byly vytvořeny pravděpodobnostní tabulky pro predikci šířky neprořezaných špičáků a premolárů (Tab. 5). Predikce byla provedena na základě postupů podobných Moyersově analýze [8], avšak s úpravou pro specifika českého vzorku. Vzhledem k limitovanému množství dat nebylo možné vytvořit tabulky pro širší spektrum percentilů, jako je tomu v původních Moyersových tabulkách (5. až 95. percentil), a tak byly vypočítány hodnoty pro 25., 50. a 75. percentil, což představuje základní rozsah predikcí.
Predikce neprořezaných stálých špičáků a premolárů na základě velikosti jiných zubů
V této části byly zkoumány korelace mezi šířkami různých skupin stálých zubů (potenciálních prediktorů) a stálými špičáky a premoláry s cílem identifikovat vhodné prediktory pro odhad prostorových nároků neprořezaných špičáků a premolárů. Analýza zahrnovala čtyři různé modely (Tab. 7), které hodnotily vztahy mezi součty šířek různých zubů (prediktorů) a součty šířek špičáků a premolárů. Pro všechny modely byl vztah mezi proměnnými hodnocen pomocí rovnic lineární regrese Y = A + B(X), kde Y = predikovaná šířka neprořezaných špičáků a premolárů, X = součet šířek prediktorů (nezávislá proměnná), B = regresní koeficient, A = intercept, který určuje hodnotu y, když je x rovno nule, respektive posun hodnot v ose Y.
Na základě Modelu B, založeného na součtu šířek prvních molárů (16, 26, 36, 46), který prokázal nejlepší korelaci s hledanými daty, jsme vytvořili pravděpodobnostní tabulky predikující šířky neprořezaných špičáků a premolárů (Tab. 8).
Diskuse
Hlavním cílem této studie bylo přispět k optimalizaci ortodontické diagnostiky a léčby u české populace prostřednictvím ověření a případné modifikace stávajících metod predikce meziodistálních šířek neprořezaných špičáků a premolárů. Aby byla studie založená na odontometrických datech spolehlivá, je nezbytné zvolit vhodný a reprezentativní vzorek populace. V této studii byla reprezentativnost vzorku zajištěna nejen velkým počtem účastníků (n = 345), ale také homogenitou vzorku z hlediska národnosti, která byla omezena na českou populaci minimálně ve dvou generacích. Tento přístup umožňuje získat validní údaje pro české pacienty a poskytuje možnost přesnějších a spolehlivějších predikcí pro ortodontickou praxi v rámci České republiky.
Průměrné meziodistální šířky zubů v české populaci
Tato studie přináší první komplexní data o průměrných hodnotách meziodistálních šířek zubů v české populaci, což doposud nebylo v naší odborné literatuře publikováno. Výsledky měření jednotlivých zubů českých pacientů poskytují základ pro další srovnání s obdobnými studiemi z jiných zemí. Absence předchozích odontometrických studií zaměřených specificky na českou populaci zdůrazňuje potřebu dalších výzkumů v této oblasti, zejména pro přesnější stanovení standardních hodnot v rámci ortodontických a stomatologických postupů. Budoucí výzkum by se mohl soustředit na vytvoření průměrných meziodistálních rozměrů pro českou populaci na jiném vzorku a porovnat s výsledky této studie. Je totiž možné, že by mohly být mezi studiemi signifikantní rozdíly, jako například ve dvou na sobě nezávislých studiích švédské populace [15,26], na které upozornil Moorrees [18].
Při srovnání s rozměry zubů publikované Moyersem [8] můžeme konstatovat, že všechny zuby v rozsahu 16–26, 36–46 jsou v našem vzorku české populace větší, a to pro muže i pro ženy. V některých případech i o více než 0,7 mm (dolní první molár u žen). Naopak v porovnání s daty Richardsona a Malhorty [27] je většina zubů v našem vzorku menší. V porovnání s tabulkou publikovanou Blackem [2], která je považována za první a základní publikaci rozměrů zubů (bez rozlišení pohlaví), je většina zubů v naší populaci meziodistálně širší. Při porovnání našeho vzorku s daty ze studie Paredese et al. [13], který měřil meziodistální rozměry Španělů a Peruánců, můžeme konstatovat, že naše výsledky jsou velmi podobné španělské skupině, a to zejména u mužů. Španělské ženy mají všechny zuby mírně větší než české ženy.
Tato zjištění nejsou překvapivá, protože odborná literatura poskytuje řadu důkazů o rozdílných meziodistálních rozměrech korunek zubů mezi jedinci a populacemi, přičemž rozdíly jsou připisovány působení genetickým, epigenetickým a environmentálním faktorům [28–30]. Na paměti bychom ale měli mít i vliv pozitivních sekulárních trendů, které byly popsány v asociaci s velikostí zubních korunek [31,32]. Na možnost sekulárních změn upozornili i Tanaka a Johnston [9], kteří doporučují regresní rovnice pro predikci prostoru pro neprořezané špičáky a premoláry po letech ověřit.
Rozdíly v meziodistální šířce zubů mezi pohlavími
Pohlavní dimorfismus ve velikosti zubů je ve světové literatuře dobře zdokumentován. V naší studii jsme zjistili, že muži mají statisticky významně všechny zuby meziodistálně širší než ženy. Tento nález je v souladu s výsledky předchozích studií, které dlouhodobě potvrzují existenci pohlavního dimorfismu v rozměrech lidských zubů, kdy muži mají meziodistálně širší zuby než ženy [12,16,18,27,33–41]. Naše výsledky se také shodují se studií Kratochvílové a Horáčka [42], která zkoumala velikosti premolárů v české populaci a zjistila, že muži mají premoláry vždy meziodistálně širší než ženy. V kontrastu s těmito nálezy jsou studie na nepálské populaci [37], kde byl zjištěn opačný trend pohlavního dimorfismu u dolních druhých premolárů, a na irácké populaci [43], kde většina dolních řezáků měla meziodistálně větší rozměr u žen. Podle Garna [39] je šířka korunky zubů mužů průměrně o 4 % větší než žen. Největší rozdíl popisuje u dolního špičáku, a to o 6 %, nejmenší u dolních řezáků. Špičáky jsou obecně považovány za zuby s největším pohlavním dimorfismem [12,18,36–38,41,44]. S tímto tvrzením se shodují výsledky naší studie. Konkrétně byl největší dimorfismus zjištěn u dolních špičáků, kde rozdíl mezi muži a ženami činil 0,47 mm (zub 33) a 0,50 mm (zub 43), tedy dolní špičáky mužů jsou průměrně o 7 % meziodistálně širší než dolní špičáky žen, což je ještě více, než zjistil Garn. Dolní špičáky jsou v naší studii následované horními špičáky s průměrným rozdílem 0,42 mm a 0,45 mm. Garn uvádí [36,40], že zuby nacházející se vedle špičáků (první premoláry a postranní řezáky) vykazují vyšší míru dimorfismu než ostatní zuby, označuje to jako „špičákové pole“. S tímto tvrzením se naše studie neshoduje, neboť špičáky jsou v míře pohlavního dimorfismu následované dolními prvními moláry a následně horními prvními moláry. Například Zorba [34], který studoval současnou řeckou populaci, nalezl největší míru pohlavního dimorfismu u horního špičáku, následovaný dolním špičákem a horním prvním premolárem. Výrazný pohlavní dimorfismus špičáků má významné implikace mimo jiné pro forenzní antropologii a další oblasti, kde je určování pohlaví na základě zubní morfologie klíčové [33].
Nejmenší dimorfismus v naší studii byl zjištěn u dolních středních řezáků, kde rozdíl činil pouze 0,09 mm (zub 41) a 0,10 mm (zub 31), následně u dolních postranních řezáků. Tento trend menších rozdílů u řezáků byl popsán i ve studii Lunda na švédské populaci [33], což také koresponduje s prací Pettenati-Soubayroux et al. [41], kteří zaznamenali velmi malé rozdíly u dolních řezáků ve své studii na populaci z doby morové epidemie v Marseille. Výsledky této studie jsou v souladu také s výsledky Pottera [38] a Arauja a Soukiho [35].
Naše výsledky tedy potvrzují, že rozdíly v meziodistální šířce zubů mezi muži a ženami jsou statisticky významné, přičemž největší rozdíly byly zjištěny u špičáků. Tento dimorfismus je často vysvětlován evolučními teoriemi, kdy větší zuby u mužů mohou být výsledkem adaptace na vyšší mechanické nároky při lovu a zpracování potravy, což vedlo k selektivnímu upřednostňování větších zubů [45]. Jiné vysvětlení pohlavního dimorfismu se opírá o rozdílné množství dentinu a skloviny u mužů a žen, kde chromozom Y je zodpovědný za podporu dentinogeneze, zatímco chromozom X ovlivňuje amelogenezi [46]. Alvesalo [47] potvrdil, že muži s karyotypy 47, XXY a 47, XYY mají větší zuby než ti s 46, XY, což dokládá genetický vliv na velikost zubů.
Predikce šířek neprořezaných špičáků a premolárů na základě součtu šířek dolních řezáků – modifikace Moyersovy tabulky pro českou populaci
V ortodontické diagnostice a plánování léčby je přesná predikce meziodistálních šířek neprořezaných špičáků a premolárů stěžejní pro rozhodnutí o optimálním terapeutickém postupu v období smíšeného chrupu. Moyersovy tabulky [8], které jsou běžně používaným nástrojem pro tyto predikce, však vycházejí z dat, která nemusejí vždy odpovídat specifikům jednotlivých populací mimo USA, kde byla původně získána. Několik autorů ověřovalo relevantnost použití Moyersových tabulek na různých populacích [1,19–25]. U některých populací, jako je čínská [24] a indická [23], bylo zjištěno, že Moyersovy tabulky systematicky podhodnocují potřebný prostor pro neprořezané špičáky a premoláry, zatímco u íránské [21], maďarské [22] a sicilské [25] populace tabulky naopak nadhodnocují predikovanou šířku těchto zubů. Na základě těchto skutečností jsme se rozhodli upravit tabulky pro českou populaci tak, aby lépe reflektovaly specifika místní populace a porovnat naše tabulky s původními Moyersovými.
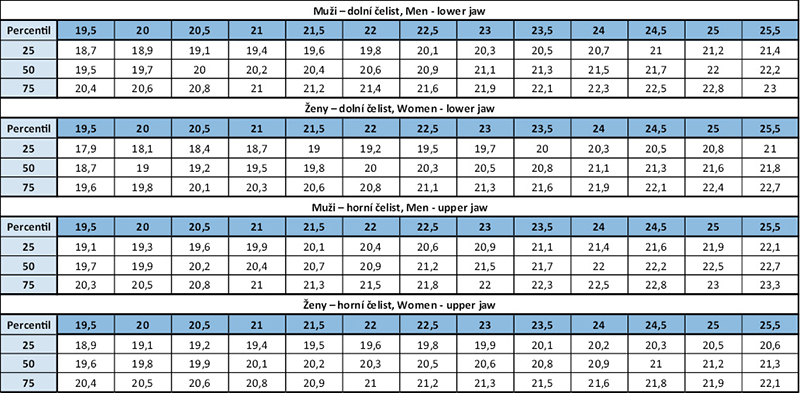
Při porovnání konkrétních hodnot jsme zjistili, že rozdíly mezi Moyersovými tabulkami (Tab. 6) a našimi tabulkami pro českou populaci (Tab. 5) mohou dosáhnout více než 1 mm na jeden kvadrant. Například u mužů při součtu dolních řezáků 24,5 mm predikuje Moyersova tabulka pro 75. percentil šířku dolních špičáků a premolárů 22,5 mm, zatímco naše data pro českou populaci uvádějí hodnotu 23,75 mm, pro horní čelist Moyersova tabulka predikuje hodnotu 22,8 mm a naše uvádí hodnotu 24,08 mm. Rozdíl mezi hodnotami v Moyersově a naší tabulce vede k celkové diskrepanci téměř 5 mm, což může mít významné klinické důsledky. Podhodnocená predikce potřebné šířky povede k nedostatku místa v zubním oblouku, tedy prořezávající zuby budou větší, než se očekávalo. V krajních případech nemusí být dostatek prostoru pro vyrovnání všech zubů a může tak dojít k neplánovaným extrakcím. Naopak, při nadhodnocení potřebné šířky bude v zubním oblouku více prostoru, tedy prořezávající zuby budou menší, než se předpovídalo. Moyersovy tabulky tedy na základě výsledků této studie můžeme označit za systematicky podhodnocující potřebný prostor pro neprořezané špičáky a premoláry. Naše výsledky také podporují tvrzení, že by Moyersovy tabulky měly být používány s opatrností [48]. Dále doporučujeme ověřit jejich použití na konkrétních populacích a případně tabulky modifikovat, nebo použít jiné metody predikce. Z hlediska klinického použití by bylo přínosné, kdyby budoucí studie otestovaly naše predikční tabulky na jiném vzorku české populace a popřípadě se zaměřily na rozšíření databáze a vytvoření tabulek pro širší spektrum percentilů, aby byly predikce ještě přesnější a univerzálnější.
Predikce neprořezaných špičáků a premolárů na základě jiných prediktorů
Predikce neprořezaných špičáků a premolárů na základě součtu šířek dolních řezáků je celosvětově nejpoužívanější metodou [8,9]. Nicméně, několik studií označilo součet dolních řezáků za nevhodný prediktor [49,50]. Na základě těchto zjištění jsme se v rámci naší studie zaměřili na nalezení jiného vhodného prediktoru než tradičně využívaný součet dolních řezáků. Otestovali jsme čtyři modely založené na různých kombinacích zubů, přičemž jsme neuvažovali horní postranní řezáky jako prediktory kvůli jejich vysoké variabilitě [50,51].
Nejsilnější korelaci se součtem šířek špičáků a premolárů poskytl model založený na součtu šířek všech prvních molárů. Tento model vykázal koeficient determinace (R²) = 0,534 pro dolní čelist a 0,511 pro horní čelist. To znamená, že model lineární regrese vysvětluje 53,4 % variability součtu šířek špičáků a premolárů v dolní čelisti a 51,1 % variability součtu šířek špičáků a premolárů v horní čelisti. Na podkladě tohoto modelu jsme prezentovali pravděpodobnostní tabulky pro predikci neprořezaných špičáků a premolárů (Tab. 8).
Naopak nejméně přesný byl model založený na součtu šířek horních středních řezáků (zuby 11 a 21), s koeficientem determinace R² = 0,336 pro dolní čelist a 0,350 pro horní čelist. Tento model vykázal nízké hodnoty korelace mezi zmíněnými zuby a součty šířek špičáků a premolárů, což je v souladu se zjištěními Seipela [10]. Moyers [8] rovněž označil horní řezáky za nevhodné pro predikční procesy z důvodu vysoké variability ve velikosti. Pro peruánskou populaci Bernabé a Flores-Mir [50] identifikovali jako nejlepší prediktor součet šířek středních horních a dolních řezáků a horních prvních molárů s koeficientem determinace 0,601. Tato hodnota patří mezi nejvyšší v literatuře. Součet meziodistálních šířek dolních středních řezáků a horních prvních molárů se ukázal být nejlepším prediktorem v italské a chorvatské populaci [52,53]. U syrské populace je to součet všech čtyř dolních řezáků a horních prvních molárů [51]. V dostupné literatuře jsme nenalezli žádné studie, které by využívaly součet šířek všech prvních molárů jako prediktor. Nicméně, mezi tímto prediktorem a součtem šířek špičáků a premolárů byla v naší studii nalezena silná korelace. Boboc a Dibbets [20] zpochybňují vhodnost použití prvních molárů jako prediktorů z důvodu jejich časté kariézní destrukce. Další autoři [50,51] navíc z predikčních modelů vyloučili dolní první moláry z důvodu možného částečného krytí gingivou v době potřebného měření, což měření znemožňuje. Na druhou stranu, v případě ageneze, retence, úrazu nebo srostlice středních horních nebo dolních řezáků, představuje náš model jedinou možnost predikce neprořezaných špičáků a premolárů, jelikož není závislý na těchto zubech, pokud neuvažujeme radiografické metody.
Opakovatelnost a reprodukovatelnost studie
Pro budoucí výzkumy lze postupovat stejným způsobem jako v této studii. Vysoká opakovatelnost studie byla potvrzena hodnotami koeficientu vnitrotřídní korelace (ICC 0,787 – 0,979) a relativní Dahlbergovy chyby (RDE 0,81 – 2,7 %). Párový t-test neprokázal systematickou chybu. Reprodukovatelnost studie může být snížena při aplikaci na odlišné vzorky české populace, avšak očekáváme, že výsledky budou pro studovanou populaci přenosné. Budoucí výzkum by mohl toto očekávání potvrdit.
Financování
Data pro tuto studii byla získána bezplatně. Statistická analýza byla provedena za úhradu, která byla pokryta z osobních zdrojů autorky studie.
Limitace studie
Velikost souboru (n = 345) je ve srovnání s jinými studiemi, které pracovaly s méně než 100 pacienty [54], považována za dostatečnou. Větší soubor dat by však mohl přinést přesnější výsledky a umožnit lepší generalizaci závěrů. Další limitací je přítomnost lidského faktoru při manuálním zadávání referenčních bodů na virtuálních modelech, což mohlo přispět k určité míře subjektivity a nepřesnostem. Stanovení referenčních bodů pro měření bylo do určité míry založeno na vizuálním odhadu, což mohlo ovlivnit spolehlivost dat. Automatizované metody měření by v budoucnu mohly tuto subjektivitu eliminovat a přinést přesnější a spolehlivější výsledky.
Závěr
• Nejvíce variabilní v meziodistálním rozměru v české populaci jsou zuby 12 a 22, naopak nejméně variabilní jsou zuby 16 a 26.
• Byl prokázán pohlavní dimorfismus u všech zubů v rozsahu horních a dolních prvních stálých molárů. Muži mají všechny zuby statisticky významně větší než ženy. Největší dimorfismus byl zjištěn u dolních špičáků (zuby 33 a 43), zatímco nejmenší rozdíly byly zaznamenány u dolních středních řezáků (zuby 31 a 41).
• Moyersovy tabulky podhodnocují skutečné rozměry špičáků a premolárů v české populaci.
• Nejsilnější korelace se součtem šířek stálých špičáků a premolárů byla nalezena u součtu šířek všech prvních molárů. Následně byly zhotoveny pravděpodobnostní tabulky pro predikci potřebného prostoru pro neprořezané špičáky a premoláry na základě součtu šířek všech prvních molárů jako prediktoru.
Autoři nemají komerční, vlastnické nebo finanční zájmy na produktech nebo společnostech popsaných v tomto článku.
Introduction
During the period of mixed dentition we may observe various orthodontic problems often arising from the discrepancy between the length of dental arch and the size of teeth. Clinically, the discrepancy manifests as crowding or spacing. To prevent the problems or to early intervene it is necessary to have an idea about future dimensions of permanent teeth erupting during the second phase of change of dentition. The accurate prediction of the space needed for erupting canines and premolars is vital for orthodontic treatment planning. The analysis of space in the mixed dentition allows to estimate the space in the dental arch for permanent dentition, and thus it is the basis of the treatment plan and required interventions, e.g. serial extractions, guided eruption, maintaining the space, obtaining the lost space, or monitoring of dentition development without any intervention [1].
Methods of prediction of mesiodistal dimensions of unerupted teeth go back to the beginning of the 20th century when Black published his tables of average dimensions of teeth [2]. However, these mean values proved unreliable due to large variation in teeth size between individual people. Methods based on radiology [3-7], statistical analyses and combination of both [8-10] made more accurate estimates possible. Moyers analysis published in 1971 in Handbook of Orthodontics [8] became used worldwide. Today in clinical practice more advanced imaging technologies are used, e.g. cone beam computer tomography (CBCT), providing three dimensional imaging of dentition and possibility to measure unerupted teeth. Though CBCT has become a common part of orthodontic diagnostics and planning, it should be indicated only in cases where it is well-founded, measuring of unerupted teeth should not be the reason for CBCT.
Nevertheless, Moyers method is a standard tool in contemporary orthodontic practice thanks to its simplicity, speed and non-invasivity [11]. The method is based on data of North American population of North European descend, and therefore, we have to question it in relation to its accuracy when applied to other populations. In the literature we find a number of evidence on different mesiodistal dimensions of crowns between individuals and populations [12–18].
A study dealing with the accuracy of prediction methods mentioned for the Czech population has not been performed yet. Therefore, the aim of the presented work was to prove the accuracy of the method and propose new prediction models that would better respond to specific characteristics of the Czech population and contribute to more accurate diagnostics and more effective treatment in orthodontic patients.
Material
The retrospective study was approved by the Ethical Committee of the University Hospital in Prague (No.81/24 S-IV). The patients and their legal representatives were educated about the participation in the project and they gave their informed consent. Intraoral scans were collected at the Department of Orthodontics, 1st Medical Faculty and University Hospital in Prague, private practice of MUDr. Jiří Tvardek, Ph.D. (Hustopeče), MUDr. Tomáš Hanzelka, Ph.D. (Prague) and MUDr. Zuzana Hýsková (Držkov). The data were collected between January 2022 and June 2024. The patients met the following criteria:
1. Czech nationals (at least 2 generations)
2. No previous orthodontic treatment
3. Erupted permanent teeth at the minimum range 16-26, 36-46, all mesial and distal surfaces of the teeth can be approached and measured
4. No anomalies regarding number and shape of teeth within the range 16-26, 36-46
5. No caries lesions, fillings and fractures involving approximal surfaces of teeth and thus disturbing mesiodistal dimension of teeth
6. Good quality panoramic scan from the initial orthodontic examination or preventive examination by general dentist
7. Intraoral scan of upper and lower jaw from the initial orthodontic examination or preventive examination by general dentist
As we had only intraoral scans at our disposal, not clinical examination of patients, eventual unclarity of 3,4 and 5 was proved in panoramic scan which was made in all the patients.
The final sample included 345 patients: 141 (40.9%) males and 204 (59.1%) females. The mean age was 18.3 ±6.5 years within the interval 11-56 years, median 16 years. 284 (82.3%) of scans and OPGs came from orthodontic practices, 61 (17.7%) from general dentists.
Method
All intraoral scans were produced by 3Shape TRIOS (3Shape A/S, Copenhagen, Denmark), converted into STL format and uploaded in the software 3Shape OrthoAnalyzer® (3Shape Ortho System, 3Shape A/S, Copenhagen, Denmark) – first virtual models were prepared and then mesiodistal widths measured by the main author of this study.
Mesiodistal widths of teeth within 16-26, 36-46 were measured. Before the measurement a model was drawn nearer and revolved in order to precisely determine optimum position of points. Each tooth width was then manually defined by mesial and distal points in the widest place of the clinical crown seen from occlusion. Mesiodistal width was measured in millimeters with the accuracy of two decimal places.
To determine the error of measurement the measurement was repeated after 4 weeks in 20 random patients. Relative Dahlberg error was between 0.81% (for tooth 21) and 2.7% (for tooth 25). ICC values were within the interval 0.787 (tooth 14) and 0.979 (tooth 12) which proves excellent match. Pair t-test did not prove systematic error (p-values were over 0.05 in all teeth).
The results of measurement were put into Excel table (Microsoft Excel for Mac, version 16.81). The data were statistically processed with the software IBM SPSS Statistics for Windows (Version 23.0, Armonk, NY: IBM Corp.). Charts were produced using TIBCO STATISTICA version 14.0. Statistical processing was performed by Mgr. Kateřina Langová, Ph.D., Department of Medical Biophysics, Faculty of Medicine and Dentistry, Palacky University in Olomouc.
Results
Mean mesiodistal widths of teeth in the Czech population
Mean mesiodistal widths of teeth (in millimeters) 16-26, 36-46 in the Czech population are given in tables (Table 1–3). Variability of mesiodistal widths in individual teeth are also recorded.
The lowest variability is observed in teeth 16 and 26 (coefficient of variation (CV) = 5%); the highest variability is in teeth 12 and 22 (CV = 8.4% and 8.2% resp.). The lowest variability in width of teeth in males is in teeth 16 and 26 (CV = 4.5% and 4.7% resp.), the highest variability is in tooth 12 (CV = 8.1%). In tooth 22 CV = 7.3% which is significantly less compared to tooth 12. The lowest variability in females is observed in teeth 26 and 16 (CV = 4.7% and 4.8% respectively), the highest variability is found in teeth 22 and 12 (CV = 8.6% and 8.4%). The mean value of coefficient of variation in males is 5.8%, in females 5.9%. The variability of teeth is slightly higher in women, however, the difference is not statistically significant, p = 0.645.
Differences in mesiodistal widths of teeth between sexes
Two sample t-test proved significantly wider teeth in men, p<0.05 in all teeth (Tab. 4). The largest sexual dimorphism is shown in lower canines – the mean difference 0.47 (tooth 33) and 0.50 (tooth 43) – followed by upper canines. Significantly dimorphous are also lower first molars and upper first molars. The least dimorphous difference is observed in lower central incisors – the mean difference 0.09 (tooth 41) and 0.10 (tooth 31).
Prediction of widths of unerupted canines and premolars based on the sum of widths of lower incisors – modification of Moyers table for the Czech population
Based on the data on mesiodistal width of teeth in the Czech population probability tables for prediction of width of unerupted canines and premolars were made (Tab. 5). Prediction was based on the processes similar to Moyers analysis [8], however, with regard to specifics of the Czech population sample. Due to the limited amount of data, it was not possible to create tables for a wider spectrum of percentiles as in the original Moyers tables (5th to 95th percentile). Therefore, values for 25th, 50th and 75th percentiles were calculated, i.e. the basic range of predictions.
Prediction of unerupted permanent canines and premolas premolars based on the size of other teeth
We examined correlations between widths of different groups of permanent teeth (potential predictors) and permanent canines and premolars. The aim was to determine convenient predictors to estimate space requirements of unerupted canines and premolars. The analysis included four models (Tab. 7) evaluating relationships between the sums of widths of different teeth (predictors) and the sums of widths of canines and premolars. In all models the relationship between variables was evaluated with the help of equations of linear regression Y = A + B(X), where Y = predicted width of unerupted canines and premolars, W = the sum of predictors’ widths (independent variable), B = regression coefficient, A = intercept determining the y value when x = 0, or shift of values in Y axis respectively.
Based on the model B, i.e. the sum of widths of first molars (16,26,36,46), that proved the best correlation with the data searched, we created probability tables predicting widths of unerupted canines and premolars (Tab. 8).
Discussion
The main objective of the presented study was to contribute to optimization of orthodontic diagnostics and treatment in the Czech population by means of verification and possible modification of existing methods of prediction of mesiodistal widths of unerupted canines and premolars. The study is based on odontometric data and to be reliable it is necessary to choose a suitable and representative sample of the population. In our work this was facilitated by a great number of subjects (n = 345) and by the sample homogeneity from the view of nationality – the subjects included were Czech nationals for at least two generations. This enables to obtain valid data on Czech patients and provides more accurate and reliable predictions for orthodontic practice in the Czech Republic.
Mean mesiodistal widths of teeth in the Czech population
The study brings complex data on mean values of mesiodistal widths of teeth in the Czech population for the first time in our literature. Results of measurements of individual teeth of Czech patients provide the basis for further comparisons with similar studies from abroad. The lack of odontometric studies focused specifically on the Czech population emphasizes the need for further research, in order to establish more precisely standard values for orthodontic and dental treatment. Future research should focus on establishing mean mesiodistal dimensions for the Czech population using another sample and compare the results with the results of the presented study. It is possible that there might be significant differences between the studies as it was e.g. in two independent studies of the Swedish population [15, 26] cited by Moorrees [18].
Comparison with teeth dimensions published by Moyers [8] shows that all teeth within 16-26, 36-46 are bigger in the Czech population, both in men and women. In some cases by more than 0.7 mm (lower first premolar in women). On the contrary, the comparison with data cited by Richardson and Malhorty [27] shows that most teeth in our sample are smaller. Comparison with the table published by Black [2], that is considered the first and basic publication on teeth dimensions (without the difference between sexes), shows that most teeth in our population are wider mesiodistally. When we compared our sample with the data given by Paredes et al. [13] who measured mesiodistal dimensions in Spaniards and Peruvians, we concluded that our results are very similar to that of the Spanish population, especially men. Spanish women have all teeth slightly bigger that than Czech women.
The findings are no surprise as in the literature we can find a number of evidence on different mesiodistal dimensions of teeth crowns between individuals and populations where the differences are attributed to genetic, epigenetic and environmental factors [28–30]. However, we should not forget the influence of positive secular trends described in association with the size of tooth crowns [31,32]. Tanaka and Johnston [9] also pointed out the possibility of secular changes; they recommend to verify regression equations for the prediction of space for unerupted canines and premolars.
Differences in mesiodistal width of teeth between sexes
Sexual dimorphism in teeth size is well described in the literature. In our study we found that men have significantly wider all teeth in mesiodistal dimension than women. This agrees with the results of previous studies that prove the existence of sexual dimorphism in the dimensions of human dentition, where men have mesiodistally wider teeth than women [12,16,18,27,33-41]. Our results also agree with the study by Kratochvílová and Horáček [42] dealing with the size of premolars in the Czech population and found that in men premolars are always mesiodistally wider than in women. On the contrary, the studies with the Nepal population [37] show the inverse tendency of sexual dimorphism in lower second premolars, and the studies on the Iraqi population [43] show mesiodistally wider lower incisors in women. According to Garn [39] the crown in men is on average by 4% wider than in women. The greatest difference is in lower incisor canine (by 6%), the smallest in lower incisors. In general, canines are considered teeth with the most significant sexual dimorphism [12,18,36-38,41,44]. This agrees with our results. Namely, the greatest dimorphism was found in lower canines where the difference between men and women was 0.47 mm (tooth 33) and 0.50 mm (tooth 43), i.e. lower canines in men are mesiodistally wider by 7% on the average than in women (more than reported by Garn). In our study, lower canines are followed by upper canines – the average difference is by 0.42 mm and 0.45 mm. Garn [36,40] reports that teeth adjacent to canines (first premolars and lateral incisors) show higher degree of dimorphism than the rest of dentition, he speaks about the so-called „canine field“. Our study does not agree with this as – with regard to sexual dimorphism - canines are followed by lower first molars and upper first molars. E.g. Zorba [34] who studies the contemporary Greek population found the highest degree of sexual dimorphism in upper canine, followed by lower canine and upper first premolar. Significant sexual dimorphism of canines has significant implications for e.g. forensic anthropology and other areas where determination of sex according to morphology of teeth is vital [33].
In our study the smallest dimorphism was found in lower central incisors where the difference was only 0.09 mm (tooth 41) and 0.10 mm (tooth 31), followed by lower lateral incisors. The tendency of smaller differences in incisors was also described in the study by Lund on the Swedish population [33] which corresponds to the work by Pettenati-Soubayroux et al. [41] which found only very small differences in lower incisors of the population in the period of plague epidemics in Marseille. The results of this study also agree with those cited by Potter [38] and Arauja and Souki [35].
Our results thus confirm that the differences in mesiodistal width of teeth between men and women are statistically significant, and the greatest differences were found in canines. This dimorphism is often explained by evolution theories, where the bigger teeth in men may be the result of adaptation to higher mechanical demands in hunting and processing of food which led to selective preference of bigger teeth [45]. Another explanation of sexual dimorphism is based on the different amount of dentin and enamel in men and in women, where Y chromosome is responsible for support of dentinogenesis, while X chromosome influences amelogenesis [46]. Alvesalo [47] confirmed that men with caryotypes 47, XXY and 47, XYY have bigger teeth than those with 46, XY, which confirms genetic influence on the teeth size.
Prediction of widths of unerupted canines and premolars based on the sum of widths of lower incisors – modification of Moyers table for the Czech population
In orthodontic diagnostics and treatment planning the precise prediction of mesiodistal widths of unerupted canines and premolars plays the key role in the decision on optimum therapeutic procedure in mixed dentition. Moyers tables [8], commonly used for such predictions, are based on the data that do not always correspond to specifics of individual populations outside the USA. Several authors checked the relevancy of Moyers tables for different populations [1, 19-25]. In some populations, such as Chinese [24] and Indian [23] it was found that Moyers tables systematically underestimate the space required for unerupted canines and premolars, while in Iranian [21], Hungarian [22] and Sicilian [25] populations the tables overestimate the predicted width of these teeth. Based on these facts we decided to modify the tables for the Czech population in order to better respond to the specifics of the local population and compare our tables with the original ones.
When comparing specific values, we found that the differences between Moyers tables (Tab. 6) and our tables for the Czech population (Tab. 5) can achieve over 1 mm for one quadrant. E.g. in men in the sum of lower incisors 24.5 mm Moyers table predicts for 75th percentile width of lower canines and premolars 22.5 mm, while our modified tables give 23.75 mm; for the maxilla Moyers table predicts 22.8 mm, and our table 24.08 mm. The difference between the values in Moyers table and our table results in the overall discrepancy of almost 5 mm, which may lead to significant clinical consequences. Underestimated prediction of the required width will result in the lack of space in the dental arch, i.e. erupting teeth will be bigger than expected. In extreme cases there may by lack of space for alignment of all teeth which may result in unplanned extractions. On the contrary, in case the required width is overestimated, there will be more space in the dental arch, i.e. erupting teeth will be smaller than expected. Based on the results of our study we may conclude that Moyers tables systematically underestimate the space required for unerupted canines and premolars. Our results also support the statement that Moyers tables should be applied with caution [48]. Further we recommend to verify their use on the specific populations and modify them or apply other methods of prediction. From the viewpoint of clinical practice, it would be beneficial if our future studies test our prediction tables on a different sample of the Czech population, and focus on expansion of the database and creation of tables for a wider spectrum of percentiles so that predictions would be more precise and universal.
Prediction of unerupted canines and premolars based on other predictors
Prediction of unerupted canines and premolars based on the sum of widths of lower incisors is the most often used method worldwide [8,9]. Nevertheless, several studies concluded that the sum of lower incisors is an inappropriate predictor [49,50]. Therefore, in our study we wanted to find another suitable predictor. We tested four models based on various combinations of teeth. We did not consider upper lateral incisors as predictors due to their high variability [50, 51].
The strongest correlation with the sum of widths of canines and premolars was provided by the model based on the sum of widths of all first molars. The model showed determination correlation (R2) = 0.534 for the mandible and 0.511 for the maxilla. This means that the model of linear regression explains 53.4% variability of the sum of widths of canines and premolars in the mandible, and 51.1% of variability in the sum of widths of canines and premolars in the maxilla. Arising from this model we presented probability tables for the prediction of unerupted canines and premolars (Tab. 8).
On the contrary, the least accurate was the model based on the sum of widths of upper central incisors (teeth 11 and 21) with determination coefficient R2 = 0.336 for the mandible and 0.350 for the maxilla. This model showed low values of correlation between the given teeth and the sums of widths of canines and premolars which corresponds to the results of Seipel [10]. Moyers [8] considered upper incisors as unsuitable for prediction due to their high variability in size. Bernabé and Flores-Mir [50] found for the Peruvian population the best predictor in the sum of widths of central upper and lower incisors and upper first molars with the determination coefficient 0.601. This value is one of the highest cited in the literature. The sum of mesiodistal widths of lower central incisors and upper first molars proved as the best predictor for Italian and Croatian populations [52,53]. For the Syrian population the best predictor is the sum of all four lower incisors and upper first molars [51]. In the literature accessible we did not find any studies working with the sum of widths of all first molars as the predictor. Nevertheless, in our study there was found a strong correlation between this predictor and the sum of widths of canines and premolars. Boboc and Dibbets [20] question the suitability of the use of first molars as predictors due to their frequent caries destruction. Other authors [50,51] excluded from the prediction models lower first molars due to potential partial cover with gingiva at the time of measurement. On the other hand, in case of agenesis, retention, trauma or fused teeth of central upper or lower incisors our model represents the only possibility of prediction of unerupted canines and premolars as it does not depend on these teeth, if we do not consider radiographic methods.
Repeatability and reproducibility of the study
In future research the same process as in this study can be used. The high repeatability of the study was confirmed by the values of intraclass correlation coefficient (ICC 0.787 – 0.979) and relative Dahlberg error (RDE 0:81 – 2.7%). A pair t-test did not prove systematic error. The reproducibility of the study may be lowered when applied in different samples of the Czech population, however, we expect that the results will be transferable for the population studies. Future research may confirm the assumption.
Financing
The data for this study were obtained free of charge. Statistical analysis was paid from personal sources of the main author of the study.
Study limitations
The sample size (n = 345) is considered sufficient in comparison with other studies working with less than 100 patients [54]. However, more data could bring more precise results and make better generalization of conclusions. Another limitation is a human factor in manual placing of reference points in virtual models which might lead to some degree of subjectivity and inaccuracy. Establishing of reference points was to some extent based on visual estimate which might affect data reliability. Automated method of measurement could eliminate the subjectivity and bring more accurate and reliable results.
Conclusion
• In the Czech population the most variable teeth in mesiodistal dimension are teeth 12 and 22, the least variable are teeth 16 and 26.
• Sexual dimorphism was proved in all teeth within the upper and lower first permanent molars. All teeth of men are significantly bigger than those of women. The greatest dimorphism was observed in lower canines (teeth 33 and 43), the least differences were recorded in lower central incisors (teeth 31 and 41).
• Moyers tables underestimate actual dimensions of canines and premolars in the Czech population.
• The strongest correlation with the sum of widths of permanent canines and premolars was found in the sum of widths of all first molars. Then the probability tables were created for the prediction of the space required for unerupted canines and premolars based on the sum of widths of all first molars as the predictor.
The authors had no commercial, proprietary of financial interests in the product or companies cited in the article.
Obr. 1 / Fig. 1
Meziodistální šířky zubů v horní čelisti / Mesiodistal width of teeth in the maxilla. Provedeno v programu 3Shape OrthoAnalyzer® / Source: 3Shape OrthoAnalyzer®
Tab. 1 / Tab. 1
Meziodistální šířky zubů v české populaci / Mesiodistal widths of teeth in the Czech population
Tab. 2 / Tab. 2
Meziodistální šířky zubů v české populaci pro muže / Mesiodistal widths of teeth in the Czech male population
Tab. 3 / Tab. 3
Meziodistální šířky zubů v české populaci pro ženy / Mesiodistal widths of teeth in the Czech female population
Tab. 4 / Tab. 4
Šířky zubů u mužů a žen, průměrná diference šířek / width of teeth in men and women, the mean difference in widths
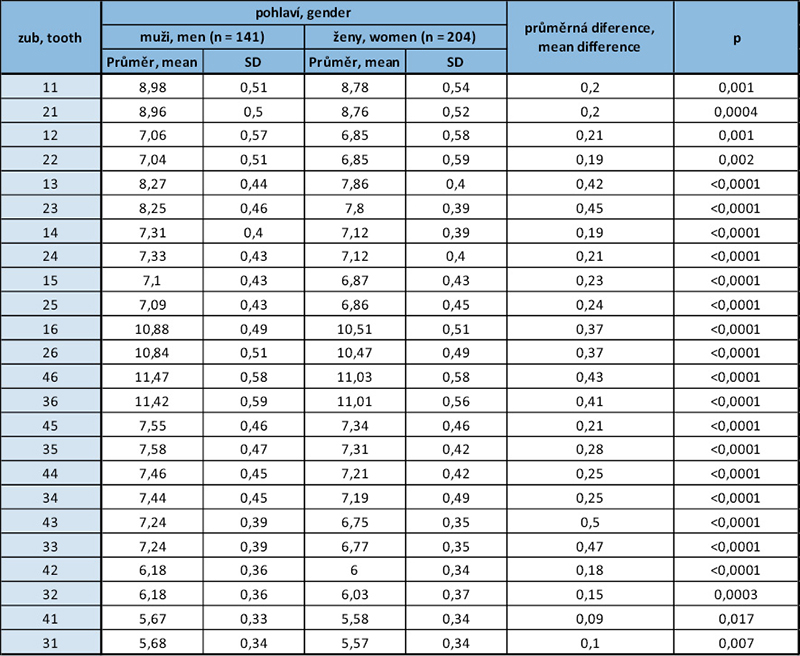
p – p-hodnota dvouvýběrového t-testu, p-value of two sample t-test
Tab. 5 / Tab. 5
Potřebné místo pro neprořezané špičáky a premoláry v dolní a horní čelisti (na základě součtu šířek všech dolních řezáků) pro muže a ženy / the space required for unerupted canines and premolars in the lower and upper jaws (based on the sum of widths of all lower incisors) for men and women.
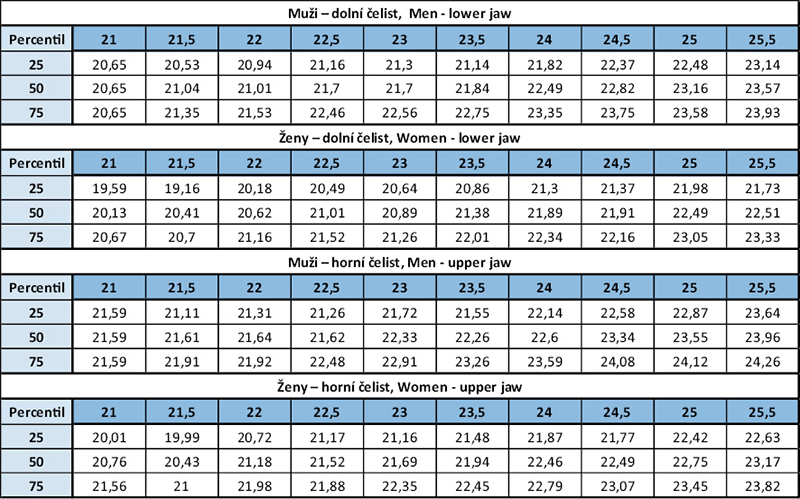
Hodnoty v prvním řádku představují součet meziodistálních šířek dolních řezáků. Ve sloupcích pod příslušnou hodnotou součtu řezáků je predikovaný součet šířek pro neprořezané špičáky a premoláry pro zvolený percentil. Values in the first line represent the sum of mesiodistal widths of lower incisors. In the columns below the relevant sum there is the predicted sum of widths of unerupted canines and premolars for the relevant percentile. Pozn.: V případě součtu šířek dolních řezáků 21 mm u mužů (první sloupec) jsou pro všechny percentily stejné predikované hodnoty pro špičáky a premoláry z důvodu malého množství dat. Note: In case of the sum of widths of lower incisors 21 mm in men (first column), predicted values for canines and premolars are the same for all percentiles due to the low amount of data.
Tab. 6 / Tab. 6
Zjednodušená tabulka podle Moyerse (pro 25., 50. a 75. percentil) / Simplified table according to Moyers (for 25th, 50th and 75th percentiles)
Tab. 7 / Tab. 7
Přehled zkoumaných modelů a hodnoty koeficientu determinace pro horní a dolní čelist / Survey of the models examined and values of determination coefficient for lower and upper jaw
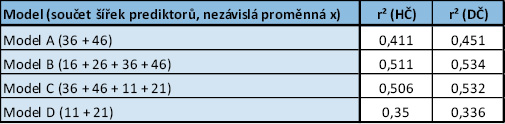
r² = koeficient determinace, který je mírou kvality regresního modelu. Ukazuje, jaký podíl variability závislé proměnné y je vysvětlen modelem. Nabývá hodnoty od 0 do 1, kdy 0 znamená, že model nevysvětluje žádnou variabilitu a 1 znamená, že model vysvětluje veškerou variabilitu. Hodnoty vyšší než 0,5 můžeme považovat za dobrou predikci, která vysvětluje více než 50% variability. r2 = determination coefficient, that is the degree of quality of the regression model. It shows the degree of variability of dependent variable y expressed by the model. It achieves values from 0 to 1, where 0 means that the model does not explain any variability, and 1 means that the model explains all variability. Values over 0.5 can be considered a good prediction explaining over 50% of variability.
Tab. 8 / Tab. 8
Pravděpodobností tabulky predikující potřebnou vzdálenost pro neprořezané špičáky a premoláry v dolní a horní čelisti (na základě součtu šířek všech prvních molárů), zvlášť pro muže a ženy / Probability tables predicting space required for unerupted canines and premolars in lower and upper jaw (based on the sum of widths of all first molars), separately for men and women.
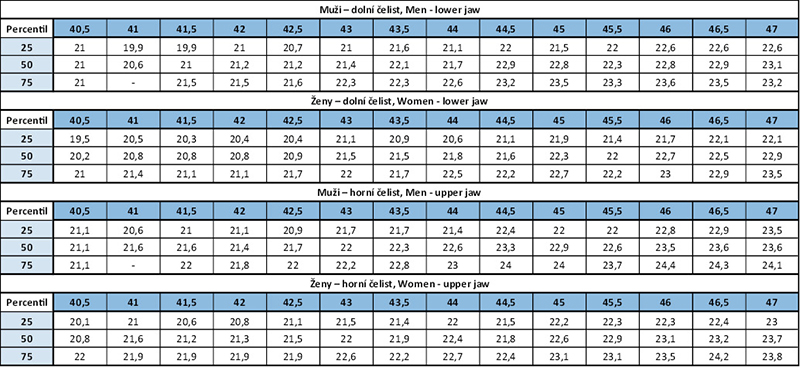
Hodnoty v prvním řádku představují součet meziodistálních šířek všech prvních molárů. Ve sloupcích pod příslušnou hodnotou součtu prvních molárů je predikovaný součet šířek pro neprořezané špičáky a premoláry pro zvolený percentil. The values in the first line represent the sum of mesiodistal widths of all first molars. In the columns below the given value of the sum of first molars there is a predicted sum of widths for unerupted canines and premolars for the given percentile. Pozn.: V případě součtu šířek prvních molárů 40,5 mm (první sloupec) u mužů jsou pro všechny percentily stejné predikované hodnoty pro špičáky a premoláry z důvodu malého množství dat. V případně nevyplněné buňky zde data úplně chybí. Note: In case the sum of widths of first molars is 40.5 mm (first colums) in men, there are the same predicted values for canines and premolars for all percentiles due to the low amount of the data. In case a cell is empty the data are missing.

Literatura / References
1. Schirmer UR, Wiltshire WA. Orthodontic probability tables for black patients of African descent: Mixed dentition analysis. Am J Orthod Dentofacial Orthop. 1997;112(5):545-551. doi: 10.1016/S0889-5406(97)70082-9
2. Black GV. Descriptive Anatomy of the Human Teeth. 2nd ed. Wilmington Dental Manufacturing Co.; 1892.
3. Nance HN. The limitations of orthodontic treatment. Am J Orthod Oral Surg. 1947;33(4):177-223. doi: 10.1016/0096-6347(47)90051-3
4. McCoy JD. Indications for the use of the x-ray in orthodontia. International Journal of Orthodontia. 1917;3(8):483-494. doi: 10.1016/s1072-3471(17)90246-9
5. Moorrees CFA, Reed RB. Correlations among crown diameters of human teeth. Arch Oral Biol. 1964;9(6):685-697. doi: 10.1016/0003-9969(64)90080-9
6. Cohen MI. Recognition of the Developing Malocclusion. Dent Clin North Am. 1959;3(2):299-311. doi: 10.1016/S0011-8532(22)03311-0
7. Huckaba GW. Arch Size Analysis and Tooth Size Prediction. Dent Clin North Am. 1964;8(2):431-440. doi: 10.1016/S0011-8532(22)01981-4
8. Moyers ER. Handbook of Orthodontics. Year Book Medical Publishers; 1988.
9. Tanaka MM, Johnston LE. The prediction of the size of unerupted canines and premolars in a contemporary orthodontic population. J Am Dent Assoc. 1974;88(4):798-801. doi: 10.14219/jada.archive.1974.0158
https://doi:10.14219/jada.archive.1974.0158
10. Seipel CGM. Variation of Tooth Position; a Metric Study of Variation and Adaptation in the Deciduous and Permanent Dentitions. Ohlsson; 1946.
11. Proffit WR, Fields HW, Larson B, Sarver DM. Contemporary Orthodontics. 6th ed. Mosby; 2018.
12. Bishara S, Jakobsen J, Abdallah E, Fernandez Garcia A. Comparisons of mesiodistal and buccolingual crown dimensions of the permanent teeth in three populations from Egypt, Mexico, and the United States. Am J Orthod Dentofacial Orthop. 1989;96(5):416-422. doi: 10.1016/0889-5406(89)90326-0
13. Paredes V, Williams FD, Cibrian R, Williams FE, Meneses A, Gandia JL. Mesiodistal sizes and intermaxillary tooth-size ratios of two populations; Spanish and Peruvian. A comparative study. Med Oral Patol Oral Cir Bucal. 2011;16(4). doi: 10.4317/medoral.16.e593
14. Deepak V, Goryawala SN, Reddy Y, Chhabra RJ, Shah NK. Assessment of Ethnicity in Indian Population using Tooth Crown Metric Dental Traits. Journal Int Oral Health. 2015;7(9):83-87.
15. Lundström A. Förtidiga mjölktandsförluster och tandställningen. Svensk Tandl Tidsk. 1944;37:698-727.
16. Lavelle CLB. Maxillary and mandibular tooth size in different racial groups and in different occlusal categories. Am J Orthod. 1972;61(1):29-37. doi: 10.1016/0002-9416(72)90173-X
17. Brook AH, Griffin RC, Townsend G, Levisianos Y, Russell J, Smith RN. Variability and patterning in permanent tooth size of four human ethnic groups. Arch Oral Biol. 2009;54(1). doi: 10.1016/j.archoralbio.2008.12.003
18. Moorrees CFA, Thomsen S, Jensen E, Yen PKJ. Mesiodistal Crown Diameters of the Deciduous and Permanent Teeth in Individuals. J Dent Res. 1957;36(1):39-47. doi: 10.1177/00220345570360011501
19. Zilberman Y, Koyoumdjisky-Kaye E, Vardimon A. Estimation of mesiodistal width of permanent canines and premolars in early mixed dentition. J Dent Res. 1977;56(8):911-915. doi: 10.1177/00220345770560081301
20. Boboc A, Dibbets J. Prediction of the mesiodistal width of unerupted permanent canines and premolars: A statistical approach. Am J Orthod Dentofacial Orthop. 2010;137(4):503-507. doi: 10.1016/j.ajodo.2008.04.031
21. Tahere H, Majid Shalchi, Fateme Mohandes, fard K, Javad M. Predicting the size of unerupted canines and premolars of the maxillary and mandibular quadrants in an Iranian population. Journal of Clinical Pediatric Dentistry. 2007;32(1):43-47. doi: 10.17796/jcpd.32.1.r066201525862144
22. Pintér Z, Rill L, Vitályos G, Farkas KB, Kolarovszki B, Frank D. Applicability of the Moyers mixed dentition analysis for the Hungarian population. Orv Hetil. 2019;160(50):1984-1989. doi: 10.1556/650.2019.31571
23. Philip NI, Prabhakar M, Arora D, Chopra S. Applicability of the Moyers mixed dentition probability tables and new prediction aids for a contemporary population in India. American Journal of Orthodontics and Dentofacial Orthopedics. 2010;138(3):339-345. doi: 10.1016/j.ajodo.2008.09.035
24. Wang Y, Li Y, Wang J, Zhao Z he. A comparison of methods for predicting the dentition space for Chinese population. Sichuan Da Xue Xue Bao Yi Xue Ban. 2008;39(4):658-660, 672.
25. Verzì P, Leonardi M, Palermo F. Mixed dentition space analysis in a eastern Sicilian population. Minerva Stomatol. 2002;51(7-8):327-339.
26. Siepel CM. Variation of tooth position. Svensk Tandläk Tidskr. 1946;39:1-176.
27. Richardson ER, Malhotra SK, Nashville M. Mesiodistal crown dimension of the permanent dentition of American Negroes. Am J Orthod. 1975;68(2):157-164. doi: 10.1016/0002-9416(75)90204-3
28. Townsend G, Bockmann M, Hughes T, Brook A. Genetic, environmental and epigenetic influences on variation in human tooth number, size and shape. Odontology. 2012;100(1):1-9. doi: 10.1007/s10266-011-0052-z
29. Dempsey PJ, Townsend GC. Genetic and environmental contributions to variation in human tooth size. Heredity (Edinb). 2001;86(Pt 6):685-693. doi: 10.1046/j.1365-2540.2001.00878.x
30. Lin TH, Hughes T, Meade MJ. The genetic and environmental contributions to variation in the permanent dental arch form: a twin study. Eur J Orthod. 2023;45(6):868-874. doi: 10.1093/ejo/cjad054
31. Harris EF, Potter RH, Lin J. Secular trend in tooth size in urban Chinese assessed from two-generation family data. Am J Phys Anthropol. 2001;115(4):312-318. doi: 10.1002/ajpa.1087
32. Garn SM, Lewis AB, Walenga A. Evidence for a secular trend in tooth size over two generations. J Dent Res. 1968;47(3):503-503. doi: 10.1177/00220345680470033401
33. Lund H, Mörnstad H. Gender determination by odontometrics in a Swedish population. J Forensic Odontostomatol. 1999;17(2):30-34.
34. Zorba E, Moraitis K, Manolis SK. Sexual dimorphism in permanent teeth of modern Greeks. Forensic Sci Int. 2011;210(1-3):74-81. doi: 10.1016/j.forsciint.2011.02.001
35. Araujo E, Souki M. Bolton anterior tooth size discrepancies among different malocclusion groups. Angle Orthod. 2003;73(3):307-313. doi: 10.1043/0003-3219(2003)073<0307:BATSDA>2.0.CO;2
36. Garn SM, Lewis AB, Swindler DR, Kerewsky RS. Genetic control of sexual dimorphism in tooth size. J Dent Res. 1967;46(5):963-972. doi: 10.1177/00220345670460055801
37. Acharya AB, Mainali S. Univariate sex dimorphism in the Nepalese dentition and the use of discriminant functions in gender assessment. Forensic Sci Int. 2007;173(1):47-56. doi: 10.1016/j.forsciint.2007.01.024
38. Yap Potter RH. Univariate versus multivariate differences in tooth size according to sex. J Dent Res. 1972;51(3):716-722. doi: 10.1177/00220345720510030501
39. Garn SM, Lewis AB, Kerewsky RS. Sex difference in tooth size. J Dent Res. 1964;43(2):306. doi: 10.1177/00220345640430022401
40. Garn SM, Lewis AB, Kerewsky RS. Sexual dimorphism in the buccolingual tooth diameter. J Dent Res. 1966;45(6):1819. doi: 10.1177/00220345660450064301
41. Pettenati-Soubayroux I, Signoli M, Dutour O. Sexual dimorphism in teeth: discriminatory effectiveness of permanent lower canine size observed in a XVIIIth century osteological series. Forensic Sci Int. 2002;12ž(3):227-232. doi: 10.1016/s0379-0738(02)00080-4
42. Kratochvílová L, Horáček M. First and second upper premolar in the treatment of an orthodontic patient. Ortodoncie. 2023;03(2023):172-188. doi: 10.61110/50069
43. Ghose LJ, Baghdady S. Analysis of the Iraqi dentition: mesiodistal crown diameters of permanent teeth. J Dent Res. 1979;58(3):1047-1054. doi: 10.1177/00220345790580030301
44. Arya BS, Savara BS, Thomas D, Clarkson QP. Relation of sex and occlusion to mesiodistal tooth size. Am J Orthod. 1974;66(5):479-486. doi: 10.1016/0002-9416(74)90109-2
45. Moreno-Gomez F. Sexual Dimorphism in Human Teeth from Dental Morphology and Dimensions: A Dental Anthropology Viewpoint. In: Sexual Dimorphism. InTech; 2013. doi: 10.5772/55881
46. Alvesalo L, Tammisalo E, Therman E. 47,XXX females, sex chromosomes, and tooth crown structure. Hum Genet. 1987;77(4):345-348. doi: 10.1007/BF00291424
47. Alvesalo L, Tammisalo E, Hakola P. Enamel thickness in 47, XYY males’ permanent teeth. Ann Hum Biol. 1985;12(5):421-427. doi: 10.1080/03014468500007981
48. Galvão M de AB, Dominguez GC, Tormin ST, Akamine A, Tortamano A, Fantini SM de. Applicability of Moyers analysis in mixed dentition: A systematic review. Dental Press J Orthod. 2013;18(6):100-105. doi: 10.1590/S2176-94512013000600015
49. Melgaço CA, de Sousa Araújo MT, de Oliveira Ruellas AC. Mandibular permanent first molar and incisor width as predictor of mandibular canine and premolar width. Am J Orthod Dentofacial Orthop. 2007;132(3):340-345. doi: 10.1016/j.ajodo.2005.07.033
50. Bernabé E, Flores-Mir C. Are the lower incisors the best predictors for the unerupted canine and premolars sums? an analysis of a Peruvian sample. Angle Orthod. 2005;75(2):202-207. doi: 10.1043/0003-3219(2005)075<0198:ATLITB>2.0.CO;2
51. Nourallah AW, Gesch D, Khordaji MN, Splieth C. New regression equations for predicting the size of unerupted canines and premolars in a contemporary population. Angle Orthod. 2002;72(3):216-221. doi: 10.1043/0003-3219(2002)072<0216:NREFPT>2.0.CO;2
52. Cattaneo C, Butti AC, Bernini S, Biagi R, Salvato A. Comparative evaluation of the group of teeth with the best prediction value in the mixed dentition analysis. Eur J Paediatr Dent. 2010;11(1):23-26.
53. Legović M, Novosel A, Legović A. Regression equations for determining mesiodistal crown diameters of canines and premolars. Angle Orthod. 2003;73(3):314-318. doi: 10.1043/0003-3219(2003)073<0314:REFDMC>2.0.CO;2
54. Kerre N, Ngesa JL, Ng’ang’a P, Kemoli AM, Bermudez J, Seminario AL. Comparison of measured and predicted mesiodistal tooth-widths of 13–17 years old Kenyans: a descriptive cross-sectional study to develop a new prediction equation for use in the mixed dentition in a Kenyan p opulation. BMC Oral Health. 2022;22(1):338. doi: 10.1186/s12903-022-02368-y
MDDr. Barbora Nedvědová
Stomatologická klinika, 1. LF UK a VFN
Kateřinská 32, 128 01, Praha 2